14
Note to readers: Relevant theory for this laboratory on field flow fractionation is typically covered in two lectures. Here, we present only a short introduction to theory, a standards-reading exercise, and the procedures, data analysis, and discussion questions corresponding to a laboratory exercise. Theory sections may be expanded into additional chapters at a later time.
1. Introduction
Multimodal or highly polydisperse samples of nanoparticles often present challenges for a comprehensive and accurate determination of the particle size distribution. Although “batch” measurements on mixtures of particles can provide an averaged size and polydispersity measure, multimodal size distributions are generally difficult to resolve. Furthermore, the size determination may be biased if the measurement is more sensitive to a subset of the population, e.g., more strongly scattering particles, that obscures other particles in the population.
Separation of the nanoparticles would enable different sub-populations to be characterized individually, thus reducing errors or interferences in the measurements. However, common methods of “batch” separation, such as filtration and centrifugation, can introduce other errors such as sample losses or destabilization. Furthermore, several sequential separation steps would be needed if multiple size fractions are desired.
Field flow fractionation (FFF) is an advanced separation technique that produces continuous sample separation, generally by hydrodynamic size or diffusion coefficient. In FFF, a laminar flow is established in a channel, such that the flow velocity is higher near the center of the channel than the walls. Therefore, sample constituents located at different heights in the channel will flow through the channel at different velocities and elute at different times. To achieve this effect, a separation field is applied that pushes the particles toward the bottom wall of the channel (termed the “accumulation wall”), while the particles concentrated near the wall also diffuse back toward the center of the channel following Fick’s law. In “flow FFF,” the separation field is created by applying a crossflow toward the accumulation wall. “Asymmetric flow FFF” (AF4) refers to the use of a channel with a solid upper wall and semi-permeable accumulation wall consisting of a membrane over a porous frit that will retain any sample components larger than the molecular weight cutoff of the membrane (e.g., 10 kDa or 30 kDa). The crossflow pushes all particles toward the accumulation wall, but smaller particles diffuse more quickly away from the accumulation wall. Therefore, a flux balance predicts that the average steady-state distance from the accumulation wall (and hence velocity out of the channel) will be higher for smaller particles, whereas larger particles reside closer to the accumulation wall and elute later.
FFF can be coupled with a number of online detectors to monitor the sample eluting from the FFF channel over time. Common detectors coupled with FFF include UV-Vis, multi-angle light scattering (MALS), and dynamic light scattering (DLS) detectors. Other detection modes could include fluorescence, refractive index, and inductively coupled plasma mass spectrometry (ICPMS). Different detection modes can yield different types of information (e.g., concentration, composition, or particle size), depending on the sensitivity of the detector to the sample constituents and selectivity toward the specific analytes of interest versus other species.
This laboratory will apply AF4 coupled with online UV-Vis and DLS detection for the analysis of a multimodal sample containing a mixture of commercial gold (Au) nanoparticles (nominally 10 nm, 30 nm, 60 nm, and 100 nm). The learning objectives of the laboratory include: (1) evaluating advantages or disadvantages of AF4 to characterize nanoparticle size distributions; (2) comparing the observed results to theoretical or expected results; (3) critically evaluating the data and potential measurement errors, based on results acquired on a known sample; and (3) understanding the benefits of the various detection modes.
The laboratory is paired with ASTM E3409-24 — Standard Test Method for Analysis of Liposomal Drug Formulations Using Multidetector Asymmetrical-Flow Field-Flow Fractionation and ISO/TS 21362:2018 — Analysis of nano-objects using asymmetrical-flow and centrifugal field-flow fractionation to support the learning objectives.
2. Relevant Documentary Standards and Reading Exercises
Exercise L4.1
Review the following test standards:
- ASTM E3409-24 — Standard Test Method for Analysis of Liposomal Drug Formulations Using Multidetector Asymmetrical-Flow Field-Flow Fractionation
- ISO/TS 21362:2018 — Analysis of nano-objects using asymmetrical-flow and centrifugal field-flow fractionation
Although ASTM E3409-24 is intended to be applied to liposomal drug formulations (rather than gold nanoparticles evaluted in this laboratory), the reading exercise below is paired with the ASTM standard because of its broader availability through university subscriptions. Only general information related to AF4 will be reviewed and applied here.
Section 6 — Interferences
- What advantage can AF4 confer over batch dynamic light scattering measurements for mitigating interferences in particle size determination, and under what circumstances is this improvement achieved or not achieved?
- What possible sample losses can occur in the AF4 system, and how can this be evaluated or quantified?
Section 10 — Mobile Phase Preparation
- How should the mobile phase be prepared?
- Propose your reasoning for why the recommended mobile phase preparation steps in the standard could be important in the sample analysis.
- How should the AF4 system be conditioned (i.e., what solvents or samples are recommended to run?)
- What is the goal of the conditioning steps?
Section 16.2 — Fractograms and Retention Time
- What are the definitions of the void time and sample retention time? What is the specification for “efficient separation”?
- Which detector(s) are recommended to be used to identify the void time and retention time?
- What data quality checks are recommended when utilizing DLS as an online detector with AF4?
- For which sizes of particles does online DLS have limitations?
3. Experimental Procedure
3.1 Chemical reagents
- Deionized (DI) water
- 10 nm Au nanoparticle stock suspension (BBI Solutions, EM.GC10)
- 30 nm Au nanoparticle stock suspension (BBI Solutions, EM.GC30)
- 60 nm Au nanoparticle stock suspension (BBI Solutions, EM.GC60)
- 100 nm Au nanoparticle stock suspension (BBI Solutions, EM.GC100)
- Au nanoparticles synthesized in Activity 1 (pink color)
- Au nanoparticles synthesized in Activity 2 (purple color)
- Sodium dodecyl sulfate
3.2 Equipment and supplies
- AF4 system components:
- o Agilent 1290 Infinity HPLC system (binary pump, degasser, and autosampler)
- o Wyatt Technology Eclipse AF4 module
- o Wyatt Technology AF4 short channel with 350 mm W spacer and 10 kDa regenerated cellulose (RC) membrane
- o Agilent 1260 Infinity UV–Vis diode array detector
- o Wyatt DAWN HELEOS II multi-angle light scattering (MALS) and dynamic light scattering (DLS) detectors
- Bottle top filters (0.22 μm polyethersulfone membrane) for mobile phase filtering
- Pipettors and pipet tips
- HPLC vials and inserts (400 µL capacity)
3.3 Procedures
Sample preparation
- Prepare the mobile phase as sodium dodecyl sulfate at 0.05 % by mass (i.e. 50 mg/L) in deionized water. Filter the mobile phase through a 0.22 μm bottle top filter.
- In an HPLC vial insert, prepare 300 µL of a sample containing a mixture of the four sizes of Au nanoparticles (10, 30, 60, and 100 nm) at a dilution factor of 5 for each size of particle (i.e., 60 µL of each size), with the remaining volume (60 µL) made up with DI water. The sample can be homogenized inside the vial insert by using the pipetter to withdraw aliquots from the insert and dispense directly back into the insert (this process should be repeated several times).
Optional: Prepare 300 µL of each of the synthesized Au nanoparticles (pink and purple) into two separate vial inserts for analysis. These samples do not need to be diluted for the analysis.
Instrument setup
Turn on the HPLC instrument and all detectors, set up the method in Table L4.1 below, and allow the system to equilibrate in the mobile phase and stabilize the detectors. Bovine serum albumin is typically injected prior to the samples for the purposes of membrane conditioning and detector calibration; the mobile phase and method are different from those used for the Au nanoparticles and are not provided here.
Table L4.1. AF4 Instrument Setup and Method Settings for Gold Nanoparticle Analysis
| PARAMETER | SETTING | NOTES |
| Mobile Phase | 0.05 % by mass (i.e. 50 mg/L) in deionized water | Filter through a 0.22 μm bottle top filter before pumping through instrument |
| AF4 Channel and Spacer | Short channel with wide spacer (350 μm height) | |
| AF4 Membrane | Regenerated cellulose, 10 kDa | |
| Detectors | UV-Vis diode array detector: Monitor 530 nm wavelength and collect spectra data (e.g. from 200 nm to 600 nm, 2 nm step size)
Dynamic light scattering: The setup in our laboratory is with detector in a backscattering position, although this is not required. |
Wavelength selection for gold nanoparticles is based on spectra collected in Laboratory 1 (UV-Vis Spectrophotometry) |
| Detector Flowrate | 0.5 mL/min | |
| Injection Volume | 100 μL | |
| Injection Flowrate | 0.2 mL/min | |
| Focus Position | 30% | |
| AF4 Method (Total run duration — 75 minutes) |
1. Elution (Crossflow = 0.5 mL/min) — 3 minutes | This step is used to establish the initial baseline position for the data analysis. |
| 2. Focus (Crossflow = 1.5 mL/min) — 1 minute | This step establishes the focusing crossflow prior to sample injection. | |
| 3. Focus + Inject (Crossflow = 1.5 mL/min) — 4 minutes | This step injects the sample and focuses the analytes into a narrow horizontal band in the AF4 channel. | |
| 4. Elution (Crossflow = 0.5 mL/min) — 50 minutes | This step is the main portion of the AF4 run, during which analytes are separated for analysis. | |
| 5. Elution + Injection (Crossflow = 0 mL/min) — 6 minutes | This step is used to flush any sample residual from the injection line and AF4 channel. | |
| 5. Elution (Crossflow = 0.5 mL/min) — 11 minutes | This step is used to establish the final baseline position for the data analysis. |
Sample analysis
- Place the sample vials in the autosampler.
- Set up the sample runs in both the Agilent and Wyatt software, and start the sample sequence.
Shutdown procedure
Save and export all of your data. Discard all samples to the waste containers provided.
4. Data Analysis
The linked Excel file (UH – Exptl Methods Nano – Laboratory 4 Data Analysis Template) contains the AF4 data collected in the laboratory for processing.
Data Processing Steps:
- Open the spreadsheet template with the data for the mixture of the four purchased gold nanoparticles (10 nm, 30 nm, 60 nm, and 100 nm). Copy the raw data into the corresponding columns of the template. A plot of the fractogram will populate with the following data:
- Normalized UV-Vis extinction at 530 nm (primary y axis)
- Normalized light scattering intensity at 90° scattering angle (primary y axis)
- Hydrodynamic radius from DLS (secondary y axis)
- Inspect the fractograms for the following features:
- Identify the void peak on the fractogram and report its retention time as tR,0.
- Identify the washout peak on the fractogram and report its retention time as tR,washout.
- Edit the normalization as necessary so that it does not include the washout peak as part of the “maximum” value selection.
- In the UV-Vis fractogram, you should observe three sample peaks. For each UV-Vis peak:
- Identify the observed retention time (tR-obs), the maximum extinction value, and half the maximum extinction value. Truncate the DLS data to the full-width at half-maximum (FWHM) across each of the three UV-Vis peaks.
- In the light scattering fractogram, you should also observe a peak at tR-obs ≈ 37 min.
- Include the DLS data across the elution time range of 33 min to 47 min (FWHM across the 90° LS peak) on your fractogram plot.
Data Evaluation:
- Assign the most likely particle size for each observed UV-Vis and/or light scattering peak in the fractogram, based on the elution time and your knowledge of the sample composition and AF4 theory. Do not analyze the void peak or the washout peaks.
- Compute the mean ± standard deviation of the DLS radius measured within the FWHM of each peak and multiply both by 2 to obtain the mean ± standard deviation of the DLS diameter, rounded to the appropriate significant figures).
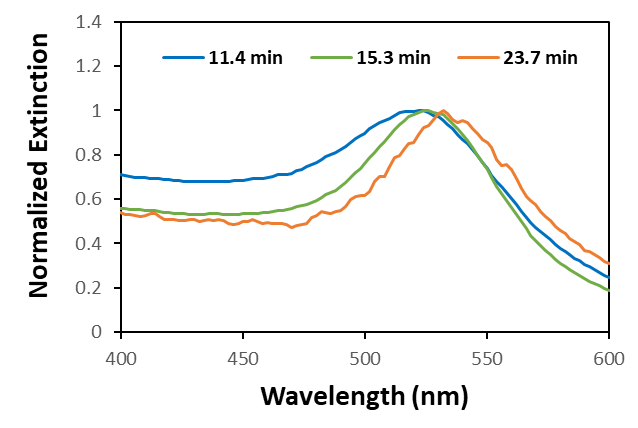
- Full spectral UV-vis extinction data were collected throughout the AF4 run. The following spectra (Figure 1) were recorded at elution times of 11.4 min, 15.3 min, and 23.7 min. The UV-Vis extinction peaks are located at around 516 nm, 520 nm, and 524 nm for the blue, green, and orange spectra. Does the overall shape and trend in peak wavelengths agree with your results from Laboratory 1 (UV-Vis Spectrophometry) for the gold nanoparticles?
5. Discussion Questions
- Online DLS data quality
Describe whether the DLS results measured for each of the four particle peaks appear to correspond with the expected size. If not, based on the data collected in the sample run, indicate which of the following reasons is likely to be the cause of the erroneous DLS data: (i) the particles did not elute or were lost in the AF4 channel; (ii) insufficient light scattering signal; (iii) excessive light scattering signal. - Benefits of multiple detection modes
Based on your results in this lab, discuss how the online hydrodynamic size data from DLS and the spectral data from UV-Vis were beneficial to interpret the AF4 sample characterization results. - Comparison of AF4-DLS to other sizing methods
Recall the batch UV-Vis and DLS analyses on the mixture of the four Au nanoparticle sizes in the prior labs. Based on the actual results observed in the Lab 1 and Lab 2 versus the AF4 results, describe any major advantages or limitations of AF4-DLS versus the batch analyses to acquire a complete and accurate size distribution on the mixture of four particle sizes. Note that you should be able to identify both an advantage and a problem in the FFF-DLS data. - Analysis of unknown Au nanoparticle samples
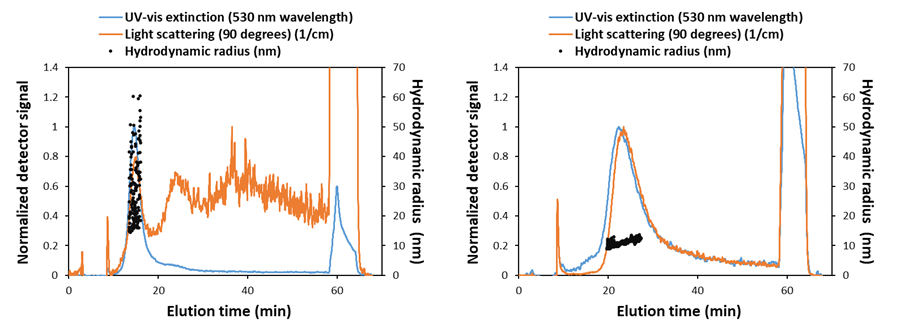
The following AF4 fractograms and sizes were measured on the “pink” and “purple” nanoparticles synthesized in class. The “purple” particles show a lower measured hydrodynamic diameter despite eluting later than the “pink” particles. Assume the membrane interactions are exactly the same for the two samples since the particles were synthesized with the same citrate and gold materials (i.e. there is no difference in repulsive or attractive membrane interactions). Propose one possible physicochemical difference there could be between the two samples that could result in this observed data.